NVIDIA Stock Analysis: A Deep Dive into the Company’s Diversified Growth Industries
NVIDIA Corporation is an American multinational technology company that has been making waves in various growth industries, including electric and autonomous driving, datacenter and cloud computing, graphics, computational power, artificial intelligence (AI) and machine learning, drones and robots, and cryptocurrency mining. With a diversified portfolio of products and services, NVIDIA has established itself as a leader in the tech industry.
Analysts’ Ratings: A Median Target Price of $670.00
The 35 analysts offering 12-month price forecasts for NVIDIA have a median target of $670.00, with a high estimate of $800.00 and a low estimate of $380.00. This represents a +7.68% increase from the last price of $622.22, indicating that many analysts believe in the company’s growth potential.
NVIDIA’s Momentum: From Gaming to AI
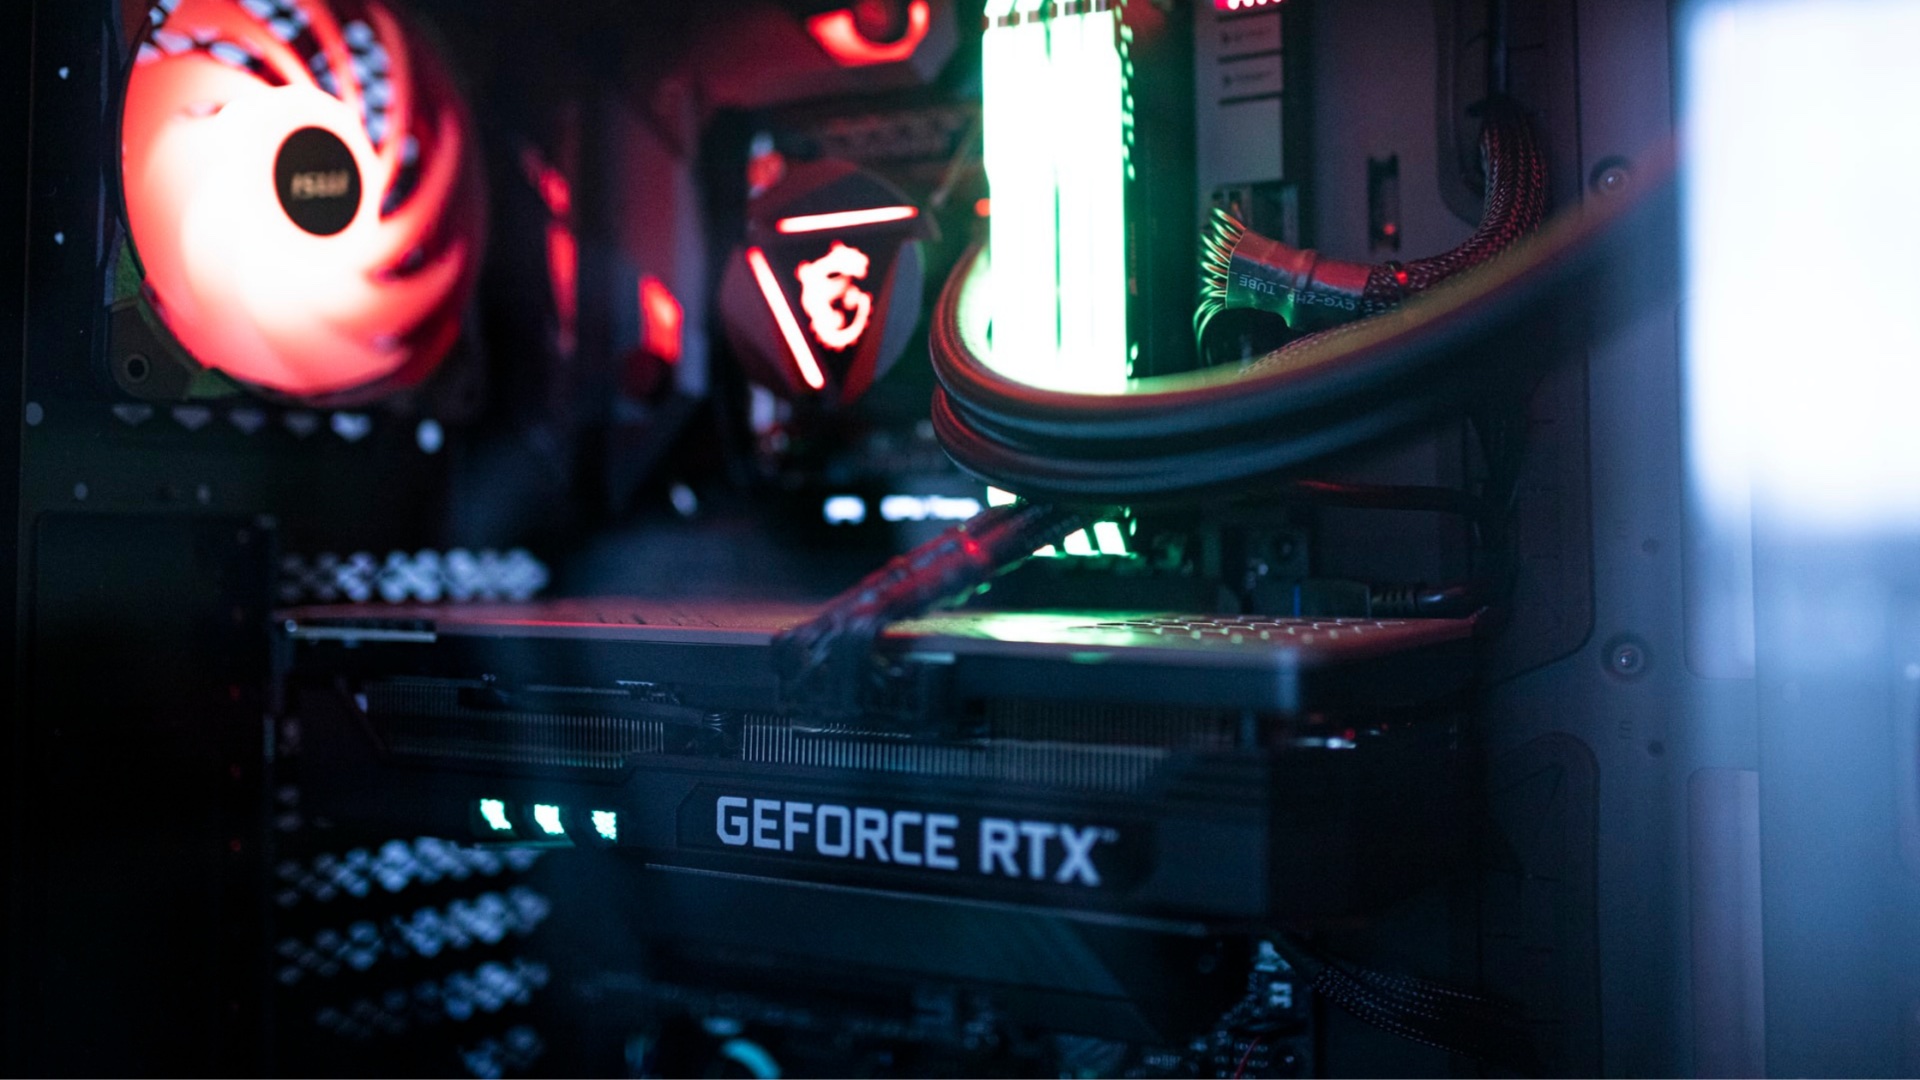
NVIDIA has had huge momentum over the years, with its gaming business turning in a stellar performance for the first quarter. Gaming revenue shot up 67% year-over-year to $2.5 billion, accounting for half of the company’s sales. Additionally, cryptocurrency-related demand is also propping up NVIDIA’s gaming business, with analysts estimating that cryptocurrency miners bought graphics cards worth $100 million to $300 million last quarter.
Understanding the 52-Week Trading Range
The 52-week trading range provides a baseline measurement of understanding normal value for a stock. When we divide this metric by 52 weeks, we can determine that the average weekly trading range for NVIDIA is roughly $7.21. This helps traders understand where they are in relation to the 52-week high and low prices.
The Vantagepoint A.I. Analysis: Trend Forecasts and Value Zones
VantagePoint Software and its artificial intelligence (A.I.) capabilities help traders identify trend forecasts by monitoring the slope of the predictive blue line. The black line is a simple 10-day moving average of price, while the predictive blue line uses advanced algorithms to determine value zones and trend direction.
Intermarket Analysis: Understanding Key Drivers of Price
VantagePoint Software’s unique ability to perform intermarket analysis helps traders locate key drivers of price for NVIDIA. By understanding these intangibles, such as interest rates, crude oil prices, and volatility, investors can uncover opportunities in other industries that affect NVDA price movement.
Conclusion: NVDA is Undervalued with a Firmly Upward Trend
NVDA is undervalued at the present time, according to analysts’ opinions. Power traders are taking advantage of lower prices and placing their protective stops below the bottom of the predictive low channel. With momentum strong on this asset, it’s likely that prices will continue to rise.
Disclaimer: Trading Risks and Cautions
There is a high degree of risk involved in trading, and it’s not prudent or advisable to make trading decisions that are beyond one’s financial means or involve trading capital that can be lost. VantagePoint’s marketing campaigns do not constitute trading advice or an endorsement of any trading methods, programs, systems, or routines.
Recommendation: Follow the A.I. Trend Analysis and Practice Good Money Management
NVIDIA deserves to be on your trading radar. Always check the current A.I. daily forecast and practice good money management on all trades. It’s not magic; it’s machine learning.

