Lumber Prices Reach New Heights: Understanding the Volatility and Implications for Traders
The commodity lumber market has been a hot topic in recent years, with prices experiencing unprecedented volatility. In this analysis, we will delve into the factors contributing to this volatility and explore the implications for traders.
A Brief History of Lumber Prices
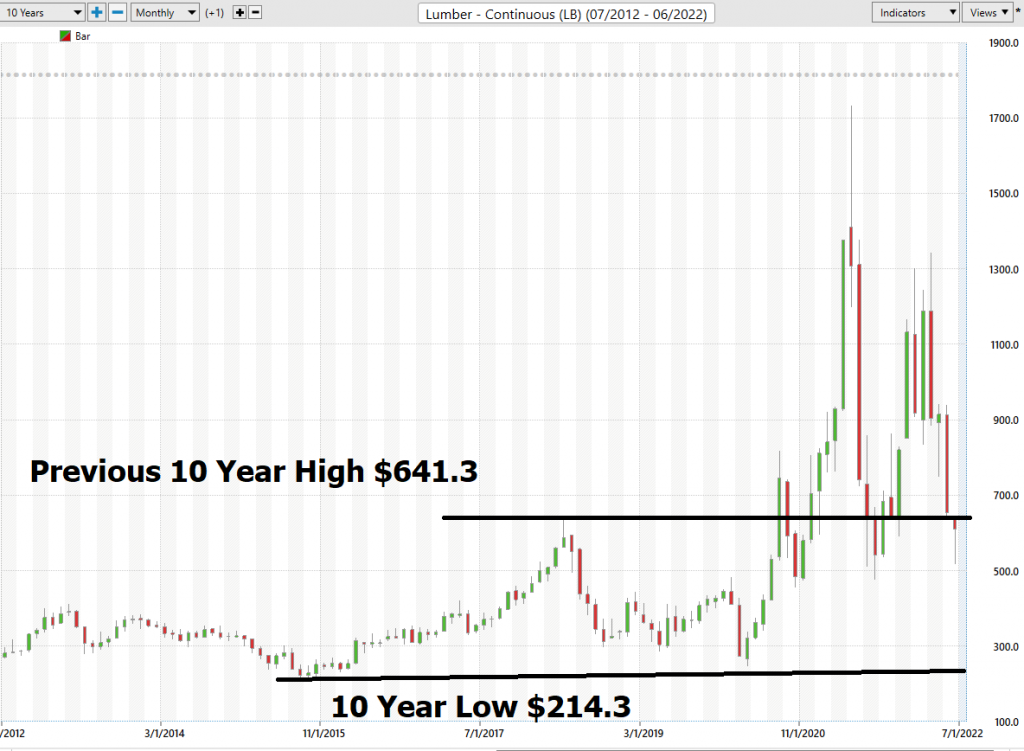
Traditionally, lumber prices have been relatively stable, trading within narrow ranges over the past decade. However, the pandemic has disrupted global supply chains, leading to a shortage of lumber supplies, a bottleneck in transportation networks, and a massive inflationary housing boom fueled by massive money supply printing.
These factors have resulted in incredible price swings, with lumber prices exploding as much as 200% higher in a few months. The National Association of Home Builders reports that the surge in lumber prices has increased home building costs by over $18,600.
The Mainstream Media’s Blame Game
The mainstream media often blames manufacturers for mis-forecasting the COVID-19 crisis and contributing to rising prices. However, this is a flawed approach, as it fails to consider the underlying supply and demand imbalances that were exacerbated by the economic shutdown and artificially low interest rates.
Volatility and Trading Ranges
To quantify the effect of these constraints on lumber prices, let’s examine the annual trading range of lumber between 2012 and present. From 2012 to 2019, pre-pandemic, the average annual trading range for lumber was $155.97. Over the last three years, it has increased by a staggering 668% to $885.2.
This level of volatility is not typical even during global pandemics and economic lockdowns. The metric does not inspire confidence in central planners or traders seeking to profit from the market’s fluctuations.
Lumber’s Impact on Industries
Wood is an essential commodity used in various industries beyond building, including paper-related products that rely heavily on wood as a base element. Let’s examine some charts illustrating how lumber prices have affected large company stock prices over the past year:
- International Paper ($IP) 52-Week Chart
- Weyerhauser ($WY) 52-Week Chart
Indicators and Metrics for Trading Lumber
In this weekly stock study, we will analyze several indicators and metrics that guide our behavior when deciding whether to buy, sell, or stand aside on a particular stock:
- 52-week high and low boundaries: We believe winners continuously make new 52-week highs, while losers make new 52-week lows.
- Best Case-Worst Case Analysis: This approach helps us evaluate the potential outcomes of trading lumber based on various scenarios.
- Vantagepoint A.I. Forecast (Predictive Blue Line): This indicator forecasts trend directions and provides valuable insights for traders.
- Neural Network Forecast: The neural network analyzes vast amounts of data to predict future market movements, providing an additional layer of confirmation for trading decisions.
The Power of Intermarket Analysis
Vantagepoint Software’s unique ability to perform intermarket analysis allows us to locate assets interconnected with lumber prices, driving its price action. By studying these correlations, traders can gain valuable insights into the underlying drivers of lumber prices and make more informed trading decisions.
Conclusion
The commodity lumber market is a volatile and complex environment that requires careful analysis and consideration. By understanding the factors contributing to this volatility and applying the right tools and indicators, traders can navigate this market with confidence. Remember, it’s not magic – it’s machine learning.

