Stock Analysis: Energy Sector Stocks
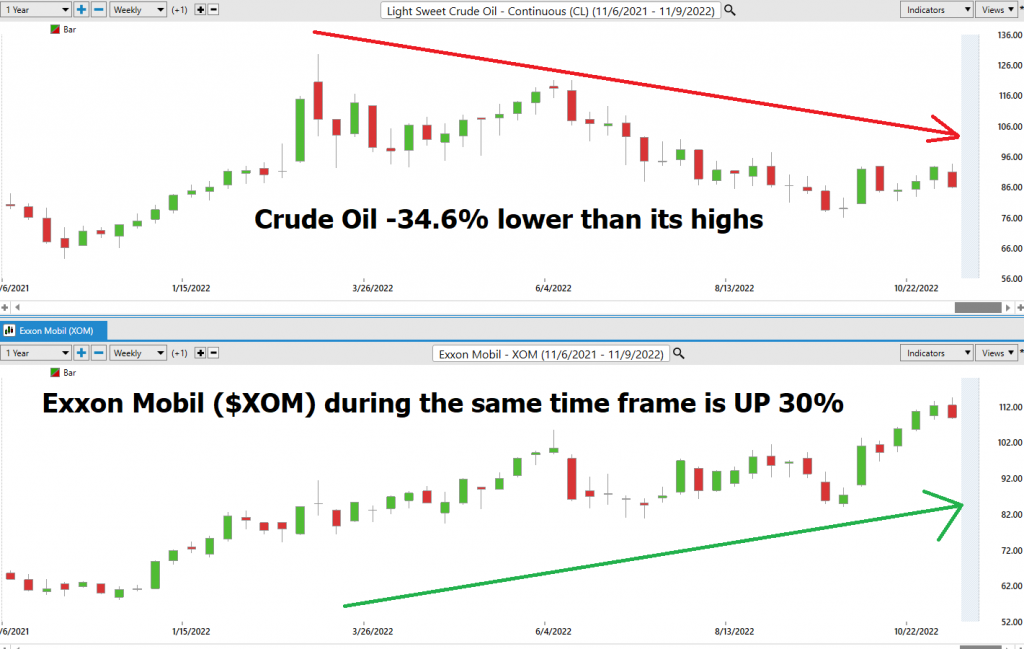
This week’s stock analysis focuses on the energy sector stocks, which have been performing well despite market volatility. Our previous analysis of the Energy Sector SPDR ($XLE) highlighted an anomaly in the charting, where ExxonMobil ($XOM) reached a new 52-week high while crude oil prices dropped by 40%. We will delve deeper into this phenomenon and explore the sector’s trend analysis.
Understanding Safe Haven Assets
A safe haven asset is an investment that retains or increases its value during times of market stress or economic turmoil. In the current financial landscape, energy sector stocks have emerged as a safe haven, performing well despite the troubles in other sectors. By identifying the winners and losers within this sector, investors can make informed decisions about their portfolios.
Who is Winning?
When analyzing markets, it’s essential to focus on who is winning and what is working. Great traders ask themselves, "What is happening?" rather than relying on wishful thinking or what should happen. In the energy sector, some stocks have outperformed others, providing opportunities for investors.
Earnings Performance
ExxonMobil ($XOM) recently reported earnings of $4.45 per share, exceeding Wall Street estimates by 14.69%. This positive earnings surprise reflects a strong performance by the company and sets a precedent for the sector as a whole. Investors should pay attention to such instances, as they often indicate future growth.
Identifying Leaders
In any market, leaders set the pace and direction. In the energy sector, stocks like $XOM, $CVX, $SLB, and $MRO have demonstrated strong performance, making new 52-week highs and challenging 10-year highs. These leaders will continue to lead the sector, and investors should focus on their price action.
Vantagepoint A.I. Forecast
Our analysis employs VantagePoint A.I.’s predictive blue line, which determines medium-term trend price forecasts. The slope of this line indicates the trend’s direction and general trend. By using the VALUE ZONE, traders can identify optimal entry points for their investments.
Fine-Tuning Entries with Neural Networks
The neural network indicator at the bottom of our charts predicts short-term strength or weakness in the market. When this indicator is green, it signals a buying opportunity, while a red signal indicates potential losses. By combining these indicators with the predictive blue line, traders can fine-tune their entries and exits.
Traders’ Guide to Energy Sector Analysis
To navigate the energy sector effectively, investors should follow the leaders, identified by their strong performance and new 52-week highs. Focusing on $XLE for trend analysis and drilling down into individual components like $XOM, $CVX, $SLB, and $MRO can help traders make informed decisions.
Disclaimer
Please note that trading involves a high degree of risk, and it’s essential to be cautious when making investment decisions. VantagePoint A.I.’s marketing campaigns do not constitute trading advice or an endorsement of any particular trading method or system.
By understanding the energy sector’s performance, identifying safe haven assets, and following the leaders, investors can make informed decisions about their portfolios and navigate market volatility with confidence.

