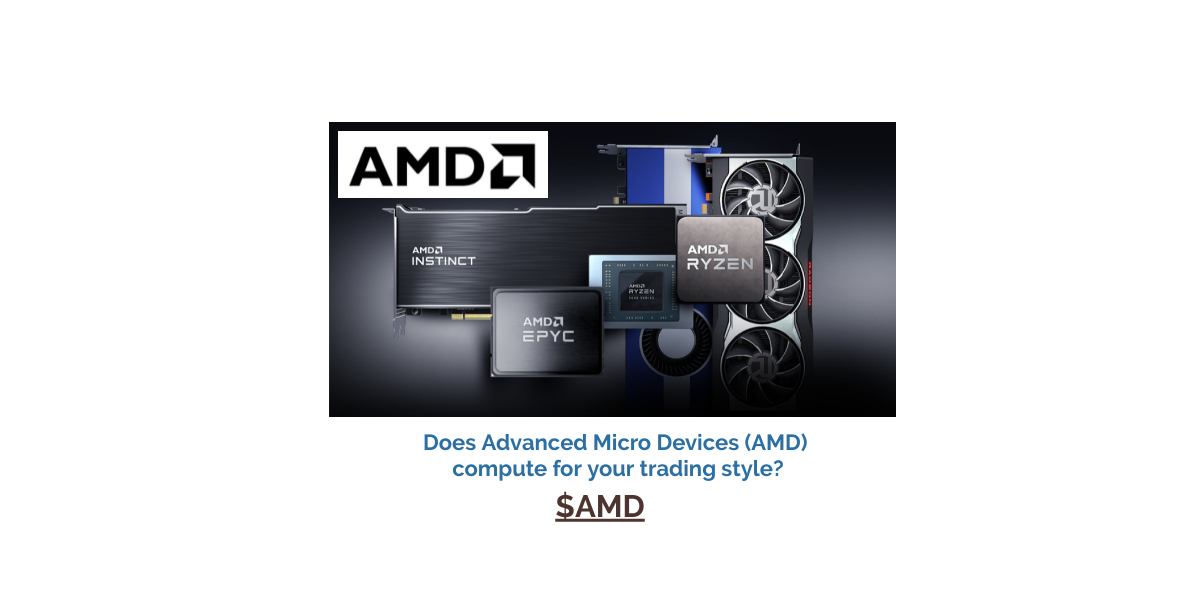
Advanced Micro Devices – AMD ($AMD) Stock Analysis: A Comprehensive Study
The week’s stock analysis focuses on Advanced Micro Devices, Inc. (AMD), a leading company in designing and manufacturing microprocessors and graphics processing units (GPUs). With its strong history of innovation and market share gains, $AMD is an attractive investment opportunity for traders and investors. This article provides an in-depth examination of the company’s performance, competitors, and technical indicators to determine whether it is a good buy, sell, or stand aside.
The Company’s Background
Advanced Micro Devices was founded on May 1, 1969, with its primary focus on microprocessors and GPUs for personal computers, servers, and other devices. In addition to CPUs and GPUs, AMD also produces chipsets, embedded processors, and semi-custom System-on-Chip (SoC) products. The company’s biggest profit center is its Computing and Graphics segment, which includes CPUs and GPUs for desktop, laptop, workstation, and gaming graphics cards. $AMD has a strong history of innovation, introducing new technologies and architectures that have helped it gain market share.
Competitors and Market Share
$AMD’s main competitors are Intel, NVIDIA, and Qualcomm. The company has approximately 25,000 employees, with its stock trading on the NASDAQ and generating 57.3 million shares per day. In 2011, $AMD reported annual revenues of $6.56 billion, while for the quarter just ending, they reported annual revenues of $23.07 billion, representing a cumulative 250% revenue growth over the last 11 years.
Fundamental Analysis
From a purely fundamental perspective, one story that has grabbed traders’ attention is the partnership between $AMD and Microsoft to create new chipsets as an alternative to NVIDIA processing units. Although Microsoft has denied the story, $AMD’s stock price has continued to move higher on the news.
In this weekly stock study, we analyze various indicators and metrics, including:
- Wall Street Analysts’ Estimates
- 52-week high and low boundaries
- Best Case – Worst Case Analysis
- Vantagepoint A.I. Forecast (Predictive Blue Line)
- Neural Network Forecast
- Daily Range Forecast
- Intermarket Analysis
Wall Street Analysts’ Estimates
We examine the average price target set by top Wall Street analysts, which is $98.00, representing a +2.61% change from the last price of $95.51. This analysis provides insight into what professionals think about $AMD’s value and potential for growth.
52-week High-Low Chart
To assess a stock’s performance, we analyze its long-term monthly and weekly charts to understand trends and evaluate the company’s normal value. The 52-week high-low chart shows that $AMD has experienced a trading range of $55.00, with its highest point at $109.57 and lowest at $54.57.
Best Case – Worst Case Analysis
We measure ideal uptrends and downtrends to get a real-world flavor of volatility and compare the asset’s rallies in comparison to its declines. This analysis provides a realistic perspective on potential price action moving forward.
Vantagepoint A.I. Analysis
Traders can utilize VantagePoint Software and its artificial intelligence to monitor trend forecasts by observing the slope of the predictive blue line. The black line indicates past market movements, while the A.I. forecast makes predictions based on statistical correlations and patterns.
The chart analysis demonstrates the effectiveness of artificial intelligence in a real-time trading scenario, highlighting double confirmation signals when both the blue predictive line and Neural Net indicate the same expected future outcome.
Neural Network Indicator
We examine the Neural Network Indicator, which forecasts short-term market strength or weakness. A green indicator represents strength, while a red indicator signals short-term weakness. Traders use this information to confirm their market positions and identify optimal entry and exit points.
Intermarket Analysis
VantagePoint Software’s unique ability to perform Intermarket analysis recognizes the interconnectedness of global markets, demonstrating how events in one market can impact prices in others. By studying these relationships, traders gain a deeper understanding of how different assets are connected and how market developments can affect prices.
Conclusion
Based on our comprehensive study, we conclude that $AMD is an attractive investment opportunity for traders and investors. With its strong history of innovation, market share gains, and technical indicators pointing to growth, we suggest following the A.I. trend analysis and practicing good money management on all trades. The opportunities for short-term swing trades abound on $AMD.
Disclaimer
Trading involves a high degree of risk, and it is not prudent or advisable to make trading decisions that are beyond your financial means or involve trading capital that you are not willing and capable of losing. VantagePoint’s marketing campaigns do not constitute trading advice or an endorsement or recommendation by VantagePoint AI or any associated affiliates of any trading methods, programs, systems, or routines.

