Apple Stock Analysis: A Comprehensive Look at Indicators and Metrics
In this week’s stock analysis, we will delve into the world of Apple ($AAPL) and examine various indicators and metrics that provide insight into its performance. As a leading tech giant, Apple has been a bellwether for the modern tech economy, with its influence extending far beyond its innovative products.
Apple’s Dominance in the Tech Sector
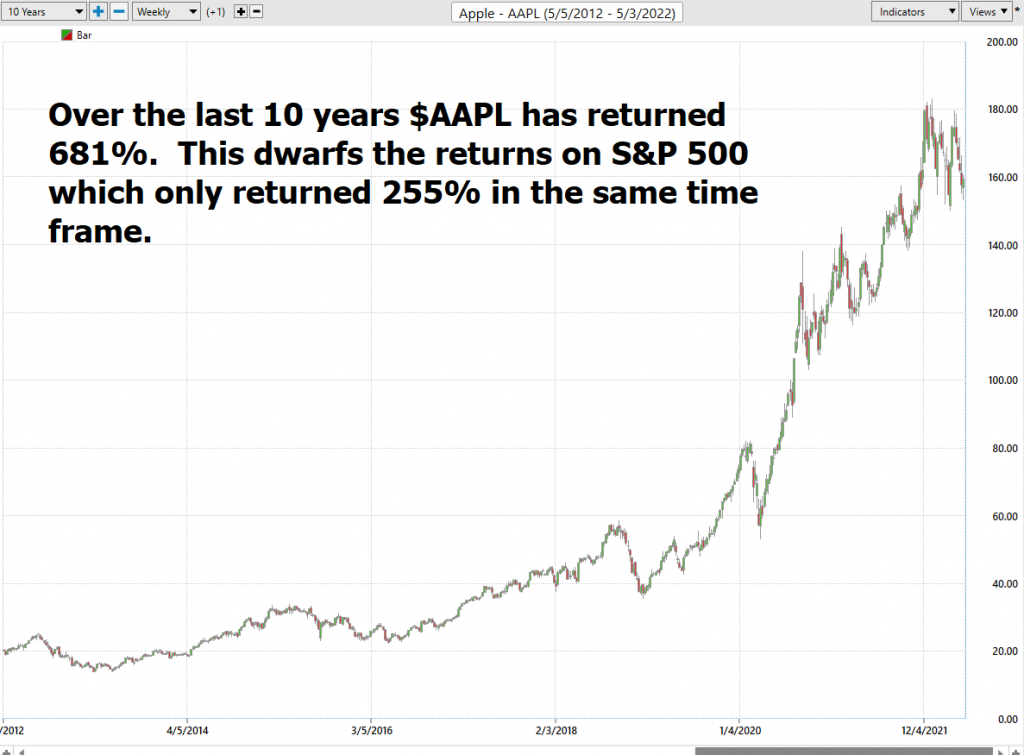
Twenty years ago, companies like Exxon Mobil dominated headlines due to their significant influence on resources. Similarly, as the computer was coming of age, IBM was considered the premier bellwether. However, Apple has become the modern equivalent, with its stock price trend reflecting its immense power and influence.
Current Price Analysis
Even at its current price, investors are paying 7 times revenue and 27.5 times earnings to own Apple stock. This is a testament to its continued dominance in the tech sector. Rumors abound that soon Apple will be launching a 5G modem, which could further boost its stock price.
Flagship Product: iPhone
The iPhone accounts for about 50% of Apple’s revenue and dominates the global market with roughly a 23.4% adoption rate. Samsung is in second place with a 19% share. This stronghold on the market makes Apple an attractive investment opportunity.
Earnings Forecast
Apple earnings are forecasted to grow by 3.8% per year, with over the last 5 years earning growth of 15%. While the tech sector has experienced a crash, $AAPL has offered a better store of value than other stocks.
Vantagepoint A.I. Analysis
We will be using Vantagepoint A.I.’s advanced indicators and metrics to analyze Apple’s stock price trend. These include the Predictive Blue Line, Neural Network Indicator, Daily Price Range prediction forecast, and Intermarket analysis.
Predictive Blue Line
The Predictive Blue Line is a key indicator that utilizes Vantagepoint’s patented Neural Network and Intermarket Analysis to determine an asset’s value. It looks at the strongest price drivers of an asset through artificial intelligence and statistical correlations.
Neural Network Indicator
The Neural Network Indicator predicts future strength and/or weakness in the market. When the Neural Net is green, it communicates strength, while a red indicator forecasts short-term weakness.
Daily Price Range Prediction Forecast
This feature provides traders with insight into anticipated price action and helps them fine-tune their entries and exits into the market.
Intermarket Analysis
VantagePoint Software’s Intermarket analysis examines how various economic indicators affect Apple’s stock price. This includes Interest rates, Crude Oil Prices, and Volatility of the dollar.
Suggestion
We suggest that traders look for buying opportunities on dips and breaks in $AAPL’s stock price. Traditionally, Apple stock does well following its launches from developer conferences. The next Apple developer conference is scheduled for June 6th, which could provide support for the market.
Conclusion
In conclusion, our analysis of Apple’s stock using Vantagepoint A.I.’s advanced indicators and metrics reveals a strong potential for growth. With a focus on buying opportunities and good money management, traders can navigate the volatility in $AAPL’s stock price.

