Macy’s: A Potential Opportunity for Gains Amidst a Challenging Retail Landscape
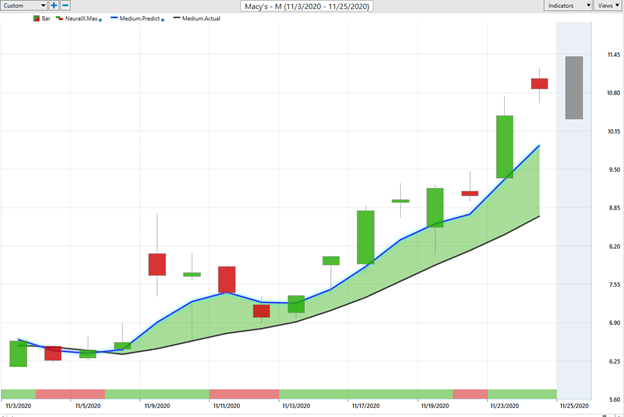
Macy’s (M) stock analysis reveals an opportunity for potential gains this month, as highlighted by the VantagePoint software. This article explores how artificial intelligence could have helped investors locate this opportunity, leveraging the predictive blue line and Neural Index indicators to determine future price action.
The Role of Artificial Intelligence in Identifying Market Opportunities
When using the VantagePoint software in trading, the predictive blue line serves as a crucial indicator for identifying upward trends. The Neural Index, which turns green when accompanied by a trend change in the medium-term forecast, provides a reliable guide for determining future price action. This synergy between the two indicators allowed traders to capture $4.27 per share in just 13 trading sessions.
The VantagePoint software’s ability to focus energy on the right market at the right time is exemplified by Macy’s (M) recent performance. Over the last year, the company’s 52-week low price was $4.38, and its 52-week high price was $18.57, resulting in a price range of $14.19. The software’s success in capturing this gain highlights its potential to provide valuable insights for traders.
Seasonal Trends and Fundamental Analysis
Companies like Macy’s (M) often experience seasonal price fluctuations before major holiday events such as Christmas. From a fundamental perspective, earnings are critical; Macy’s third-quarter loss of 19 cents per share, with revenue falling 23% to $3.99 billion, was less severe than analysts expected. However, same-store sales declined 21%, and digital sales growth slowed to 27% from 53% in the previous quarter.
Despite these challenges, Macy’s (M) has a rich history as a retail leader. Founded in 1858 by Rowland Hussey Macy, the company defined possibilities for retail penetration and became synonymous with holiday shopping experiences, including its iconic Thanksgiving Day Parade and Fourth of July fireworks display. However, today, Macy’s faces stiff competition from online retailers like Amazon.
The Power of Intermarket Analysis
A key feature of the VantagePoint software is its intermarket analysis tool, which quickly highlights the statistically most correlated assets to an underlying stock’s price movement. This allows traders to identify key drivers of an asset’s price and make informed decisions about short-term swing trading opportunities.
In the case of Macy’s (M), the intermarket analysis reveals that several stocks, ETFs, and futures contracts are closely aligned with its price movement. These correlations can provide valuable insights for traders looking to capitalize on potential gains.
A Closer Look at Macy’s Market Data
Macy’s is an American department store chain with a market capitalization of $3.3 billion and average daily trading volume exceeding 39 million shares. Its iconic Herald Square location covers nearly an entire New York City block, featuring about 1.1 million square feet of retail space, valued at approximately $3 billion.
As traders continue to navigate the challenges of the retail landscape, the VantagePoint software’s ability to identify market opportunities and provide actionable insights can be a valuable tool for success.
Conclusion
Macy’s (M) stock analysis highlights an opportunity for potential gains this month, leveraging the predictive blue line and Neural Index indicators to determine future price action. The company’s history as a retail leader and its iconic holiday events make it an attractive investment target. As traders continue to navigate the challenges of the retail landscape, the VantagePoint software’s ability to identify market opportunities and provide actionable insights can be a valuable tool for success.

